How It Works
Improve customer experience & satisfaction over time.
-
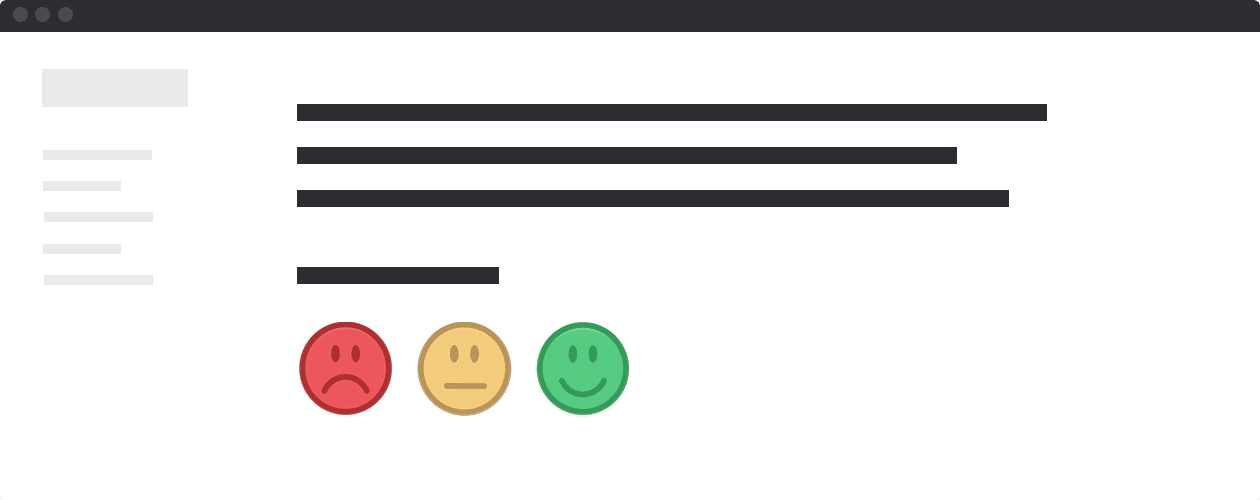
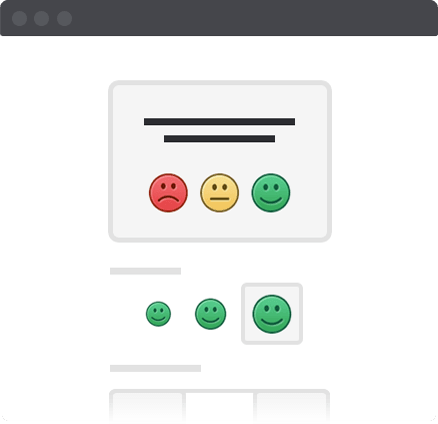 1 Create Questions
Put together a question in seconds that helps you identify an area, interaction, page or feature where you could improve.
-
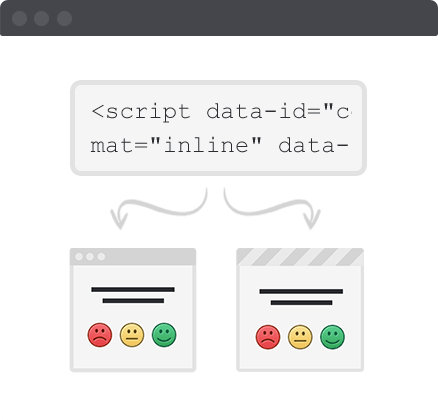 2 Add Them Anywhere
Drop in a tiny bit of code on your site or in emails where you want the question to appear.
-
 3 Get Ratings
Watch the ratings roll in from your customers, giving you real-time feedback about which areas of your business delight or disappoint.
-
 4 Analyze and Change
Pinpoint areas that need improvement & when changes to your product helped or hurt the experience. Then do something.
Start measuring & improving customer experience right now.
Benefits
-

Measure customer mood
Get a constant stream of updates on the mood of your customers at any given time across all aspects of your business.
-
Spot frustrating experiences
When you see a dip in mood, you're able to identify problematic areas of your product.
-
Know your product pulse
With a quick glance at your screen, you'll know right away how satisfied your customers are.
Features
Page tab widget
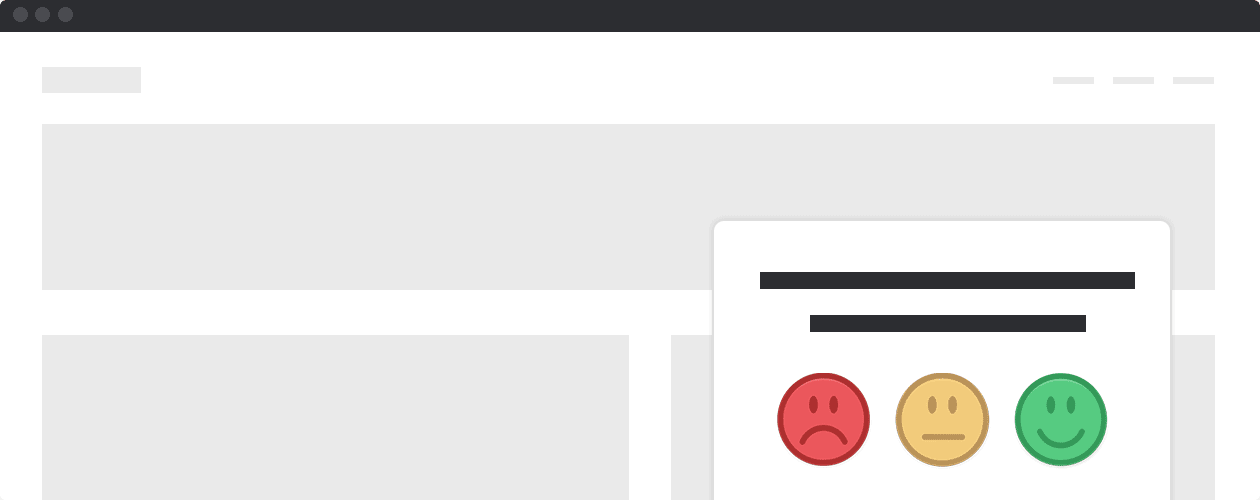
The page tab widget shows up at the bottom right of the pages you put it on. It's great for gauging how satisfied your users are with your entire product.
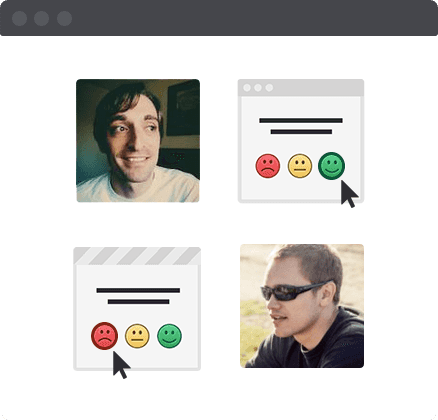
Inline widget
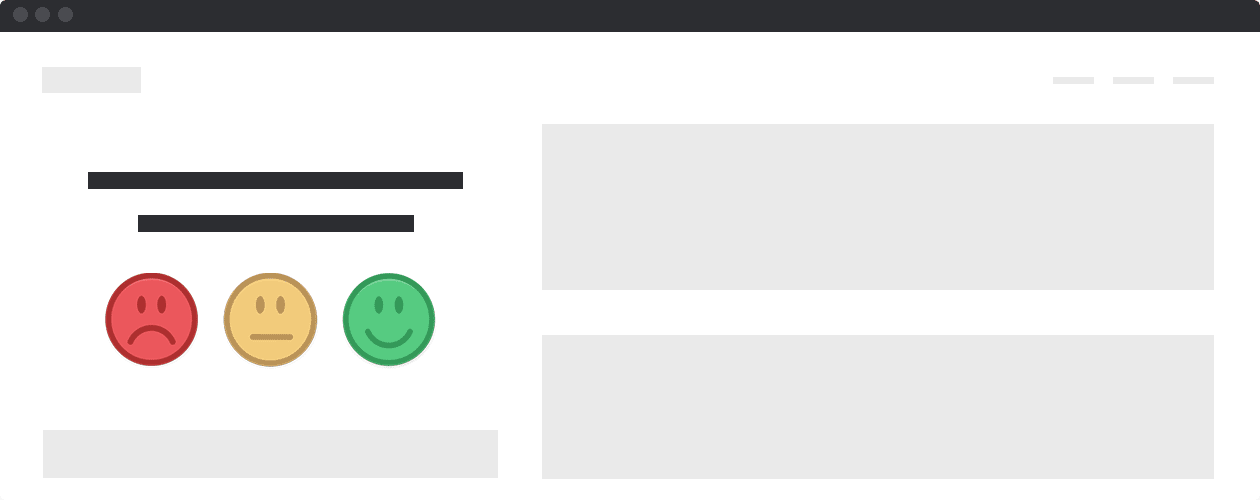
The inline widget is placed within your page anywhere you'd like to get feedback on a specific item or experience. When you're wanting to know feedback about a particular flow through your product, this is what you'd want to use.
Email widget
The email widget can be placed in any email. The most popular use of this is in customer service interactions to gauge how your customer support reps are doing.
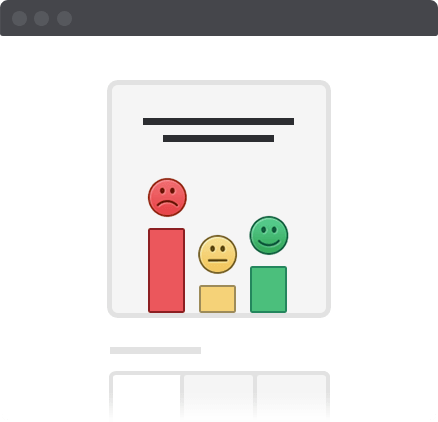
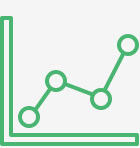
Rating graph
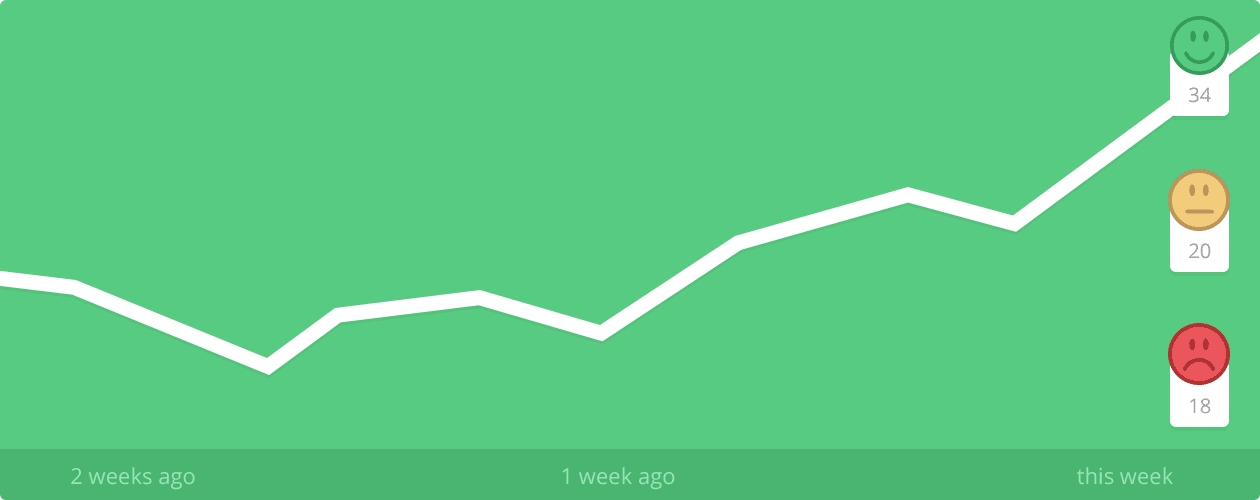
Your rating graph is what shows you the overall pulse for a given question. It's an overview of how you're doing overtime and helps you pinpoint where you've got room to improve.
Rating stream
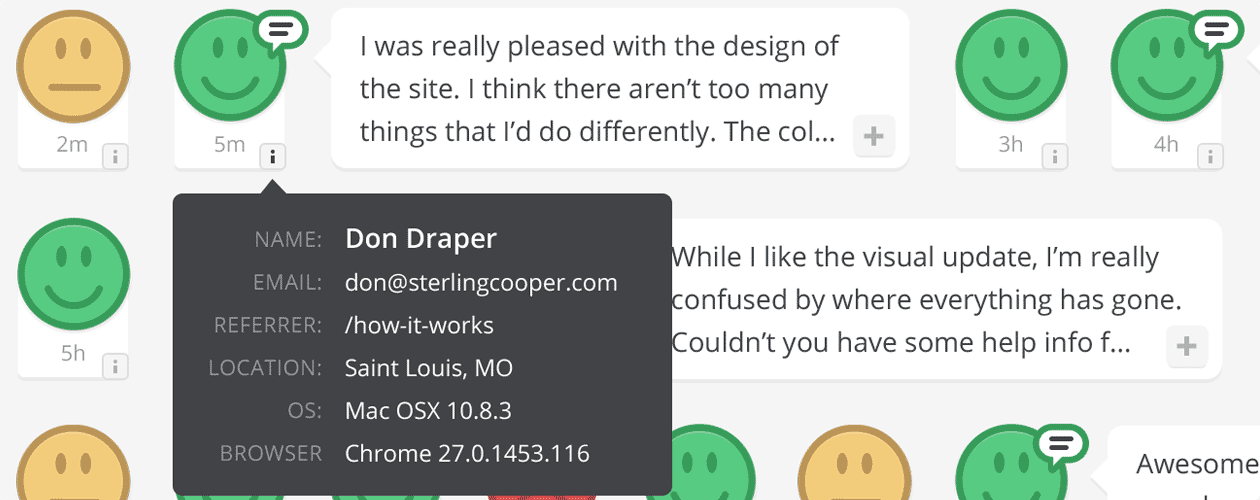
The rating stream is a detailed view of all your ratings. It's the constant stream of every rating someone makes, along with some useful data like comments, location, browser, referrer and more!
Public rating wall

The public rating wall lets you show your users how great you're doing! It's a public view (with all personal data hidden) that gives your users confidence in your ability to provide great customer service. See one in action right here!
Rating comments
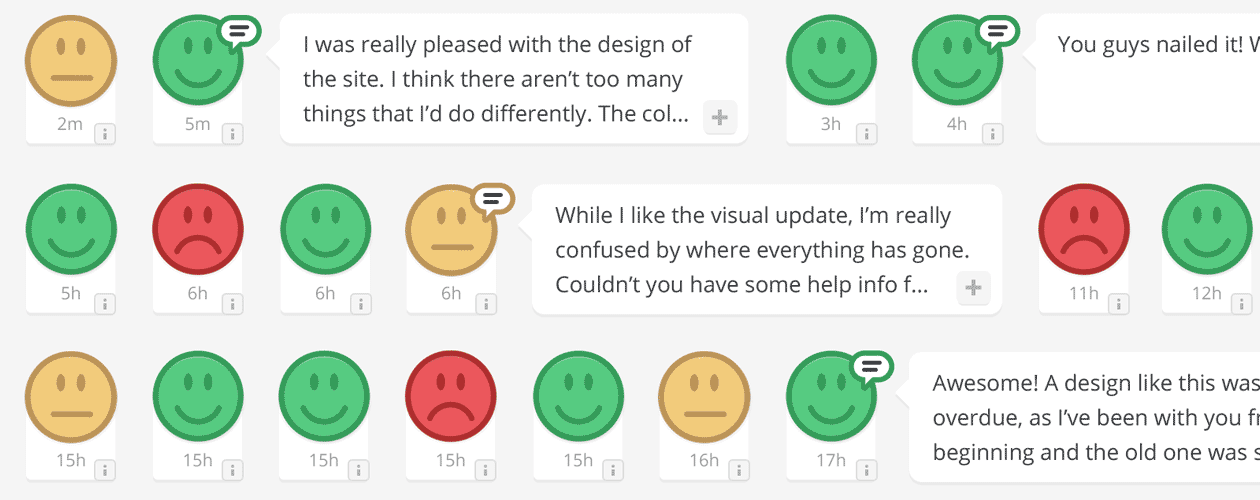
Each time someone submits a rating, we give them the opportunity to add a comment to provide some additional feedback on why they answered that way. It's a great and no-hassle way for you users to provide feedback.
Referrer data

Every rating automatically includes additional referrer data like location, referring page, browser and operating system so you can further segment your data if you'd like.
Tracking variables
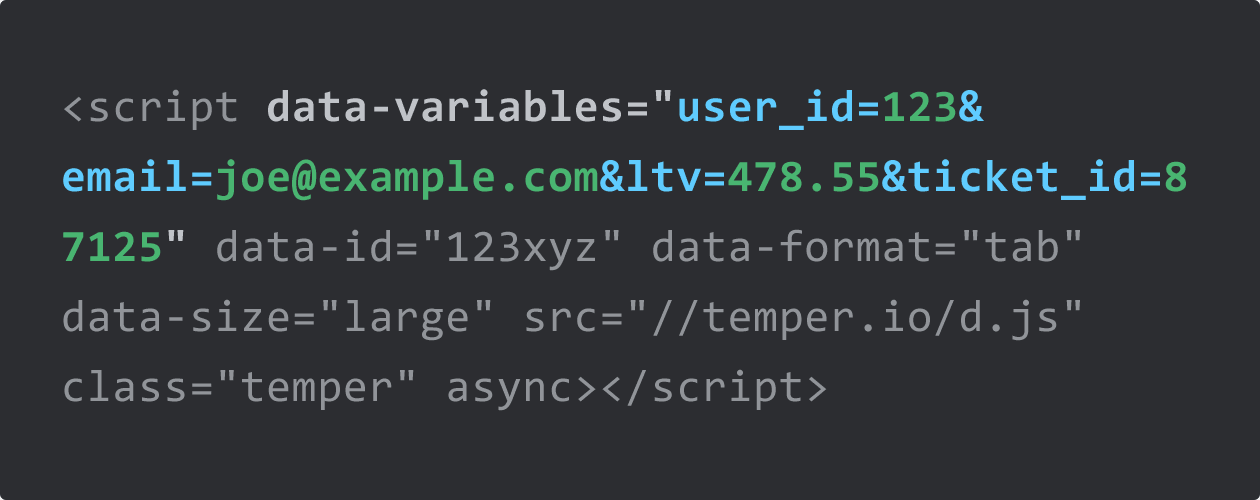
Tracking variables are a powerful feature that lets you send additional data with each rating! This could be things like user IDs, email addresses, order numbers or anything else that will help give each rating better context.
User targeting
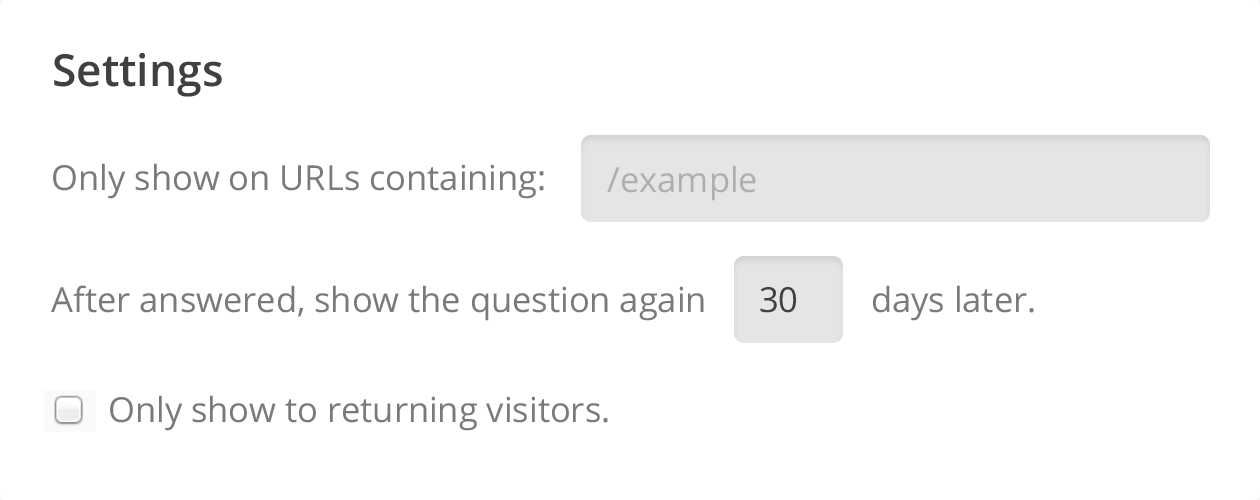
When using the page tab widget, sometimes you may only want to show the widget to certain users. Our user targeting feature lets you pinpoint exactly who should see it and how often they should see it.